Overview
nn_dataflow is an academic tool that searches for optimal
dataflow schedules on neural-network accelerator hardware, but its raw
JSON output is hard to reason about and its catalogue of supported
networks pre-dates modern mobile-optimized architectures. For my
Embedded AI final project, I added three contributions to a fork of the
tool: two Matplotlib visualization scripts that turn the JSON into
per-layer charts, and a full MobileNetV2 network definition that lets
the scheduler target a modern mobile-optimized CNN.
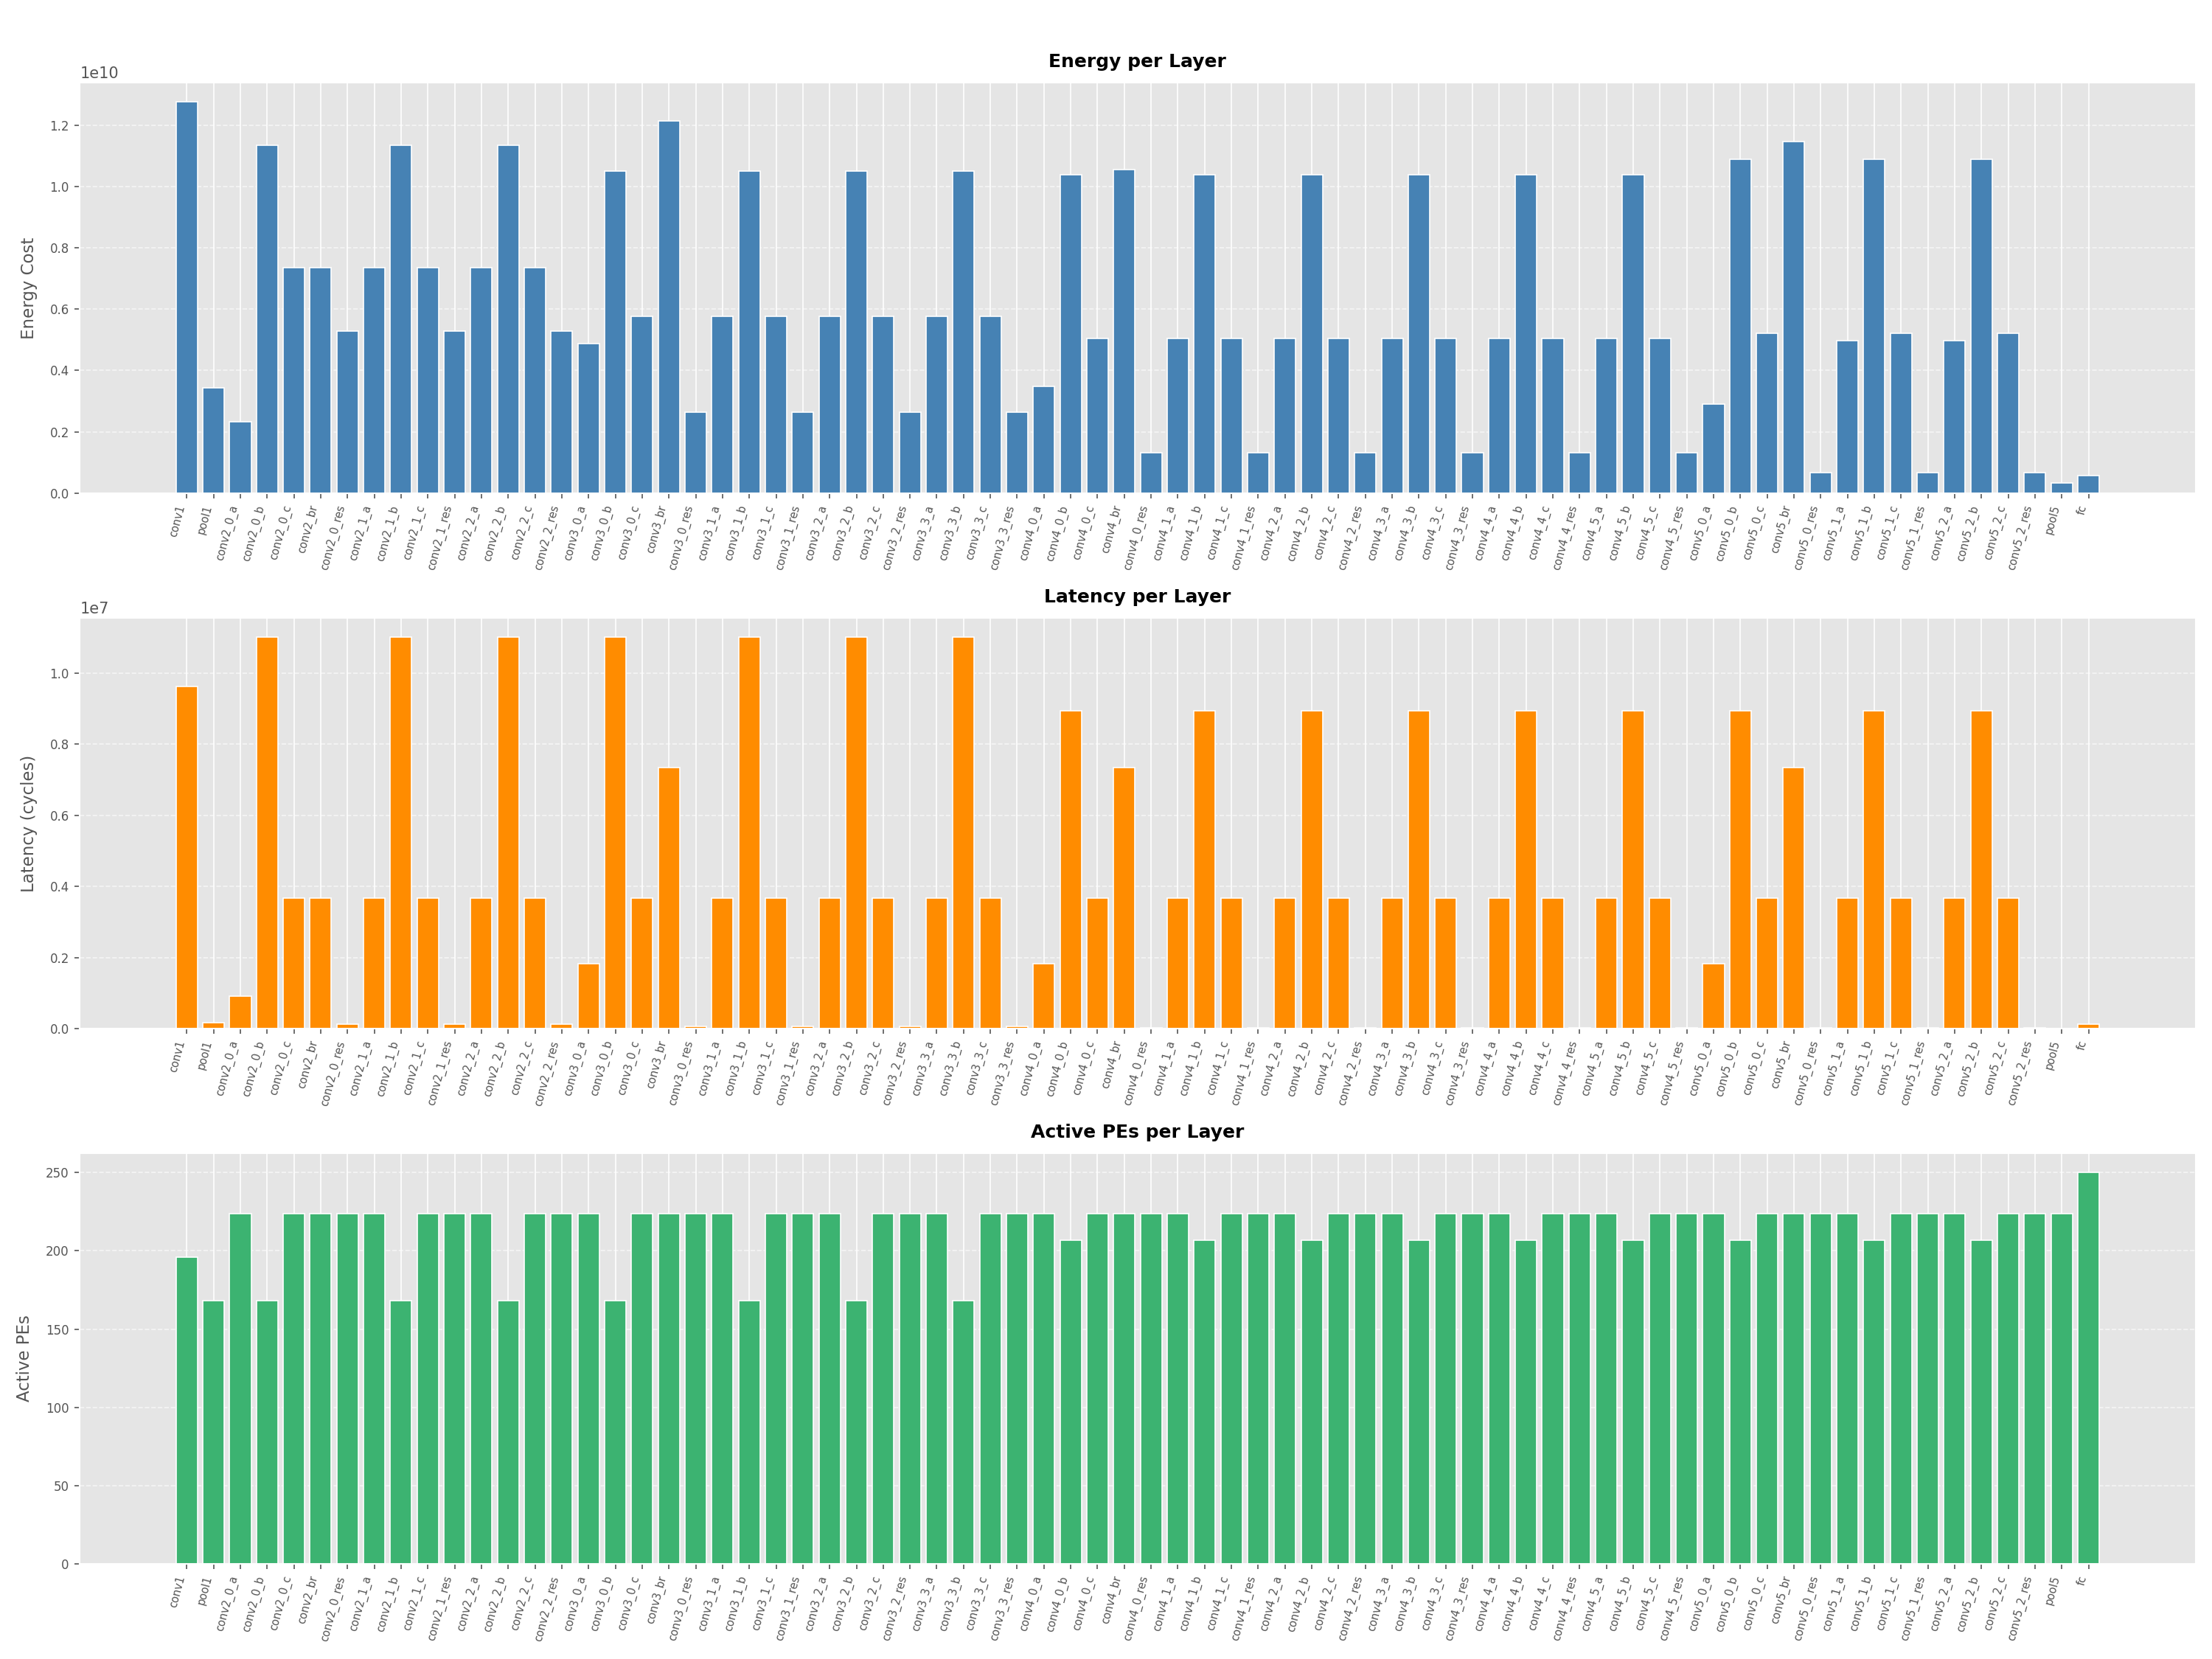
Contribution 1: Basic Visualization Script
visualization/display_results_basic.py reads a JSON output
file from nn_dataflow_search.py and produces a three-panel
bar chart showing layer-wise hardware metrics for any network and
optimization goal:
- Energy per layer — cost values from the optimal schedule found for each layer.
- Latency per layer — time in cycles from the optimal schedule found for each layer.
- Active PEs per layer — number of processing elements active during each layer.
The script validates its inputs: it confirms a JSON argument was
provided, checks the file exists and ends in .json, catches
schedules missing required keys (total_cost,
total_time, active_node_pes), and validates
the user-provided output filename against empty input, illegal
characters, and existing-file conflicts.
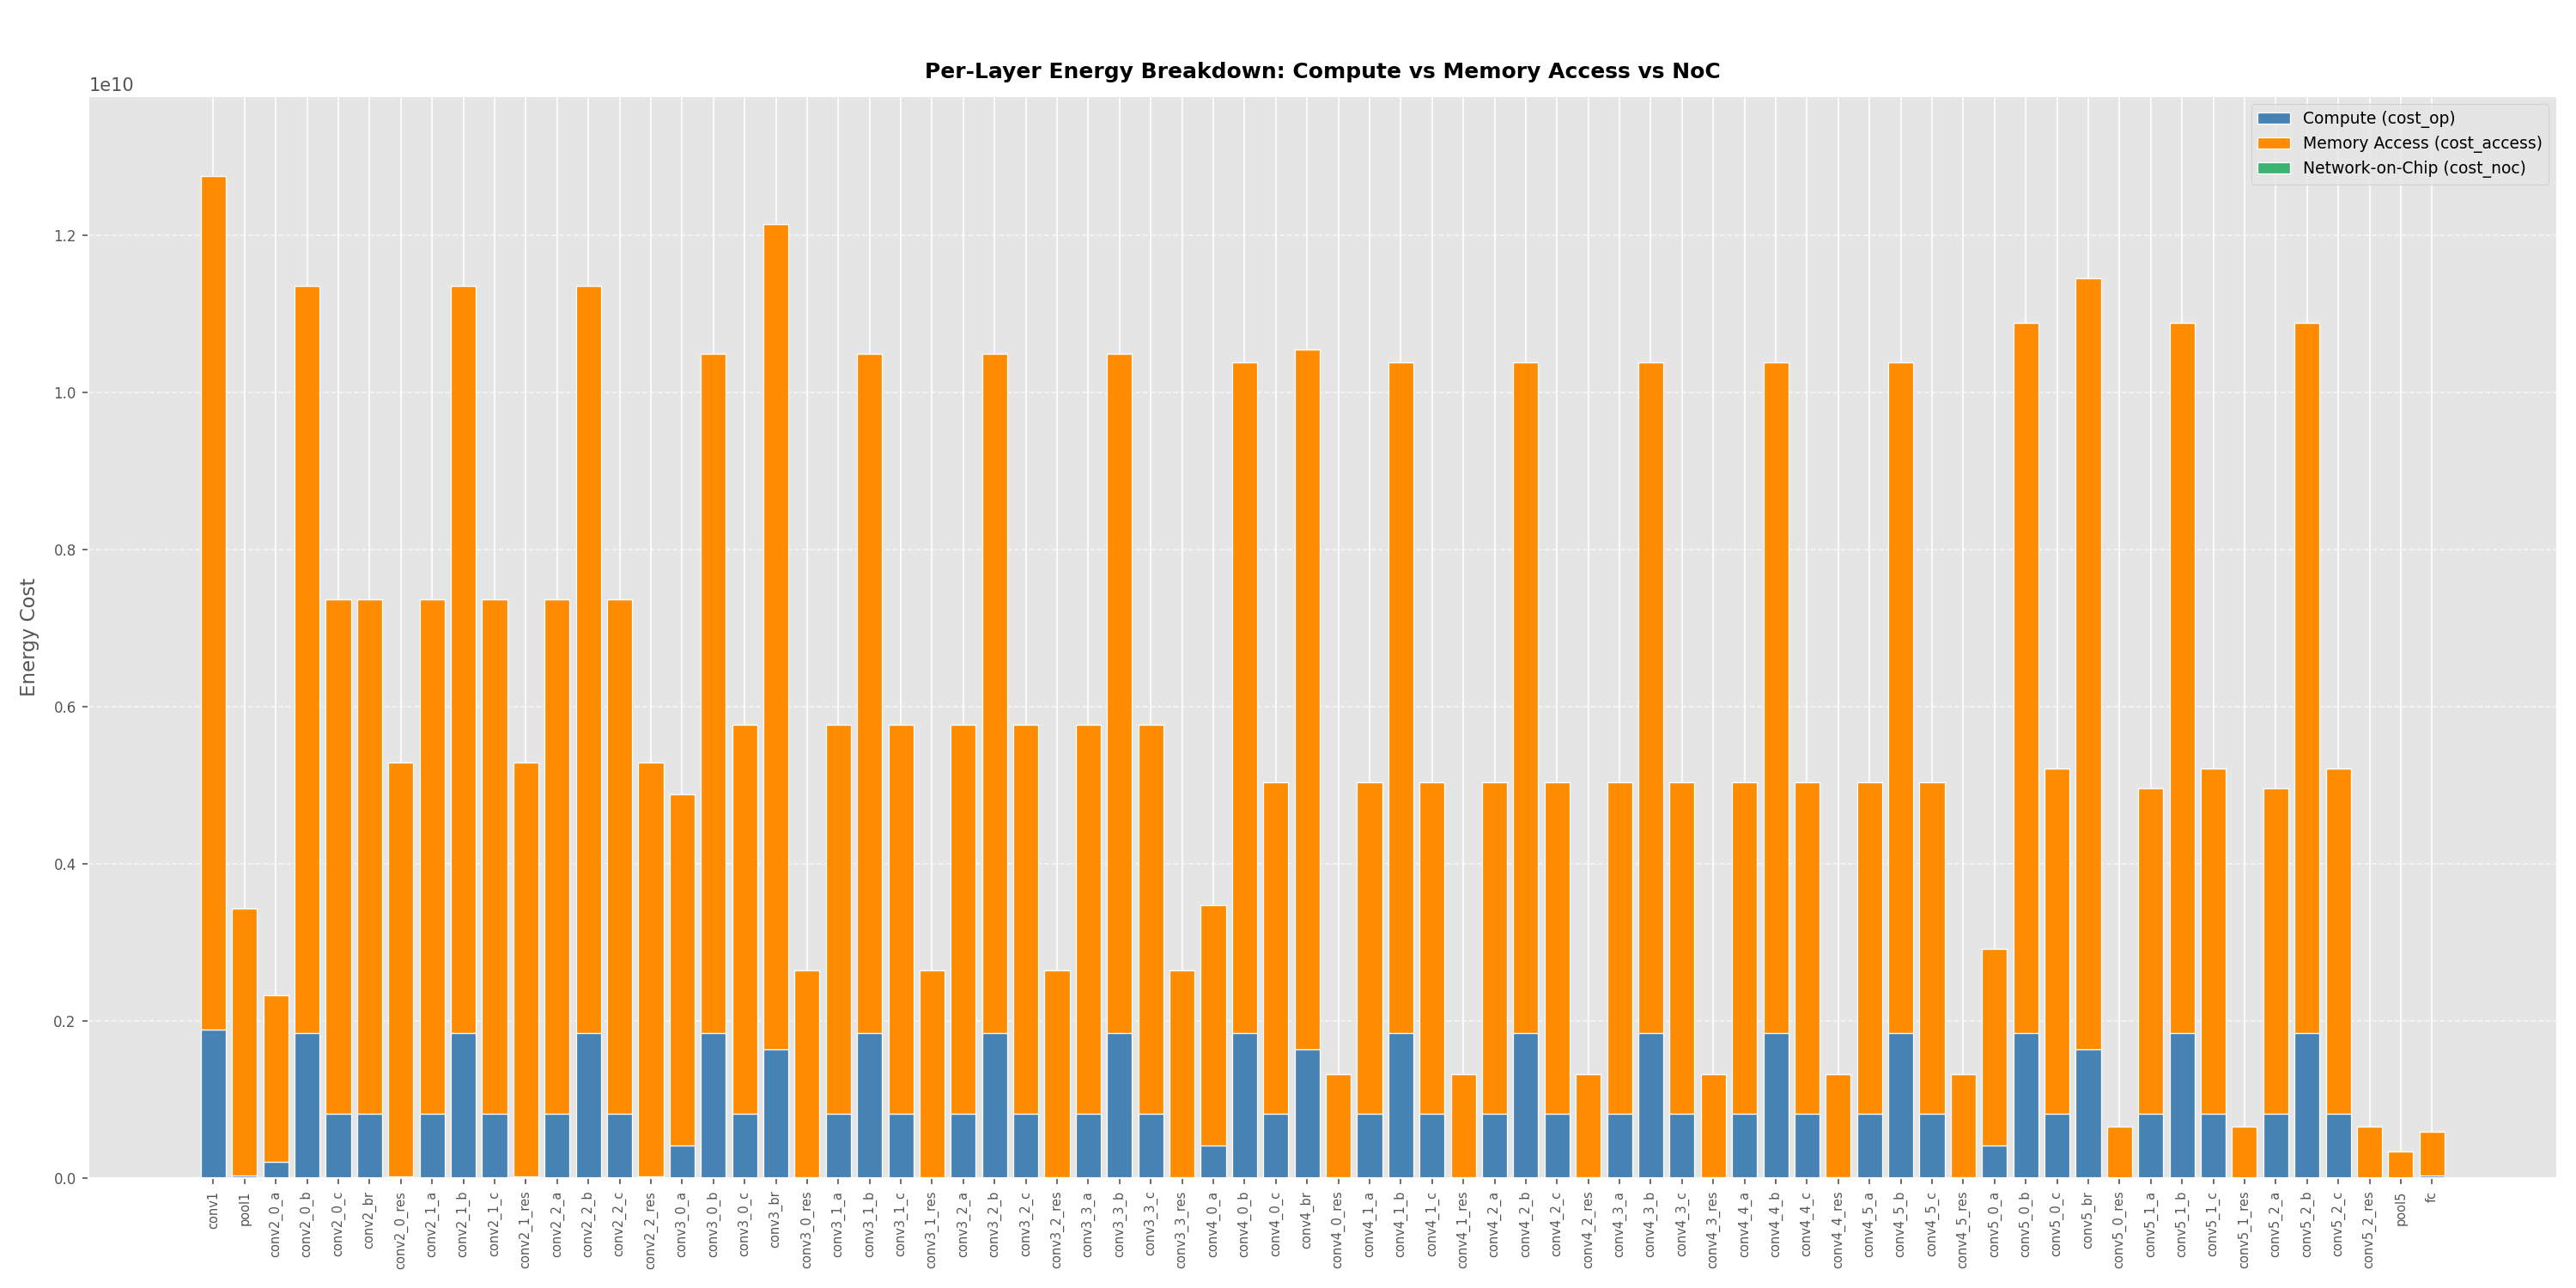
Contribution 2: Energy-Breakdown Visualization Script
visualization/display_results_energy.py produces a single
stacked bar chart that shows where each layer's energy is actually
spent. Where the basic script reads the single cost field,
this script pulls the three energy sub-components from
schedules[layer][0]:
- Compute (
cost_op) — energy spent on MAC operations. - Memory access (
cost_access) — energy spent moving data through the memory hierarchy. - Network-on-Chip (
cost_noc) — energy spent on inter-node data movement.
Each layer is rendered as one bar with the three components stacked bottom-to-top, so the full bar height equals that layer's total energy cost and the proportions make the dominant cost source obvious at a glance.
Contribution 3: MobileNetV2 Network Definition
nn_dataflow/nns/mobilenet_v2.py adds MobileNetV2 as a
supported network in nn_dataflow, following the same
conventions as the existing AlexNet, VGG-16, and ResNet-50 definitions
in nn_dataflow/nns/. Once imported, MobileNetV2 can be used
directly with nn_dataflow_search.py.
MobileNetV2 is built around inverted residual blocks. Each block is
three operations: a 1×1 pointwise expand conv that scales the
channel count by expansion factor t; a 3×3 depthwise
conv that filters channel-by-channel, modeled as a
ConvLayer with in_channels == out_channels;
and a 1×1 pointwise project conv that projects back down to the
block's output channel count c. Blocks are named after their
row in Table 2 of the paper — b2_1 and b2_2,
for instance, are the two repetitions of the t=6, c=24, n=2
row.
Two modeling notes: nn_dataflow has no dedicated depthwise
layer type, so depthwise convs are modeled as ConvLayers
with equal input and output channels (consistent with how other
nn_dataflow network definitions handle this); and batch
normalization layers are omitted entirely, as the framework has no
BatchNormLayer type and norm layers add no compute or
memory cost relevant to dataflow scheduling. The implementation was
validated against Table 2 of the MobileNetV2 paper and verified through
the project's built-in test suite.